
Revenue confidence has been on my mind.
Just like that, the focus for just about every company on the planet has shifted from “How are we going to hit our number this quarter?” to “How are we going to retain our customers and speed up new logo velocity at the same time?”. These are just a few examples of questions that companies are asking themselves beyond salvaging their current quarter forecast.
Slipped deals, decreasing sales prices, shrinking out-quarter pipeline, and existing customers not expressing the confidence that they’ll renew or buy more are creating more concerns about the state of the business.
To steer the ship in the right direction, your revenue teams must rally around key health indicators so they can quickly recognize risk, identify opportunity, and formulate game plans that impact the bottom line.
Here are 3 critical revenue metrics that are now top of mind at every board meeting, forecast call, and virtual one-on-one sales meeting — in the pursuit of revenue confidence:
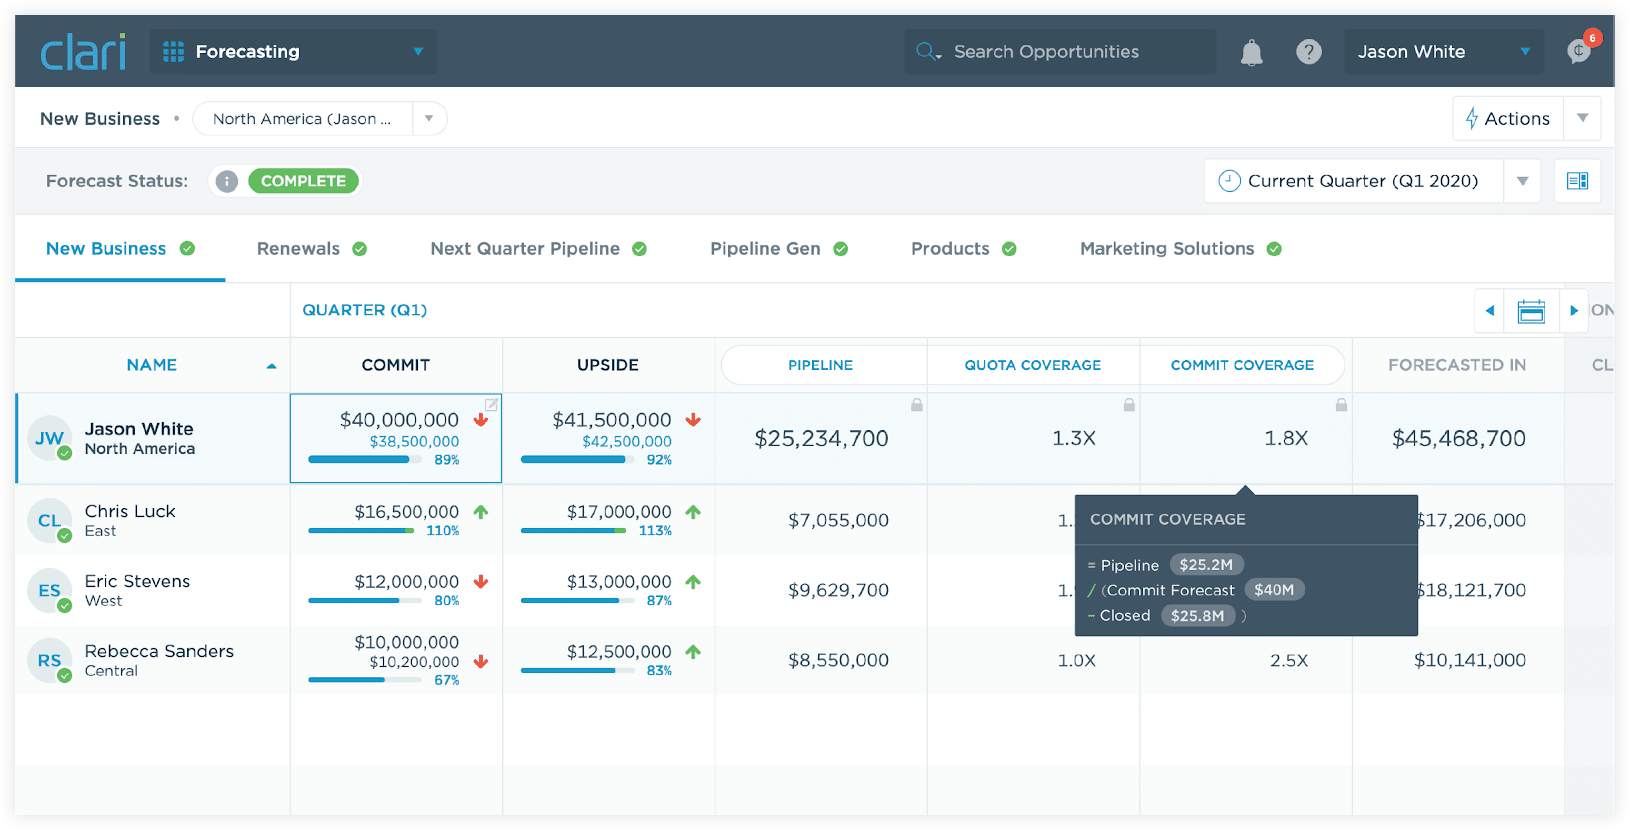
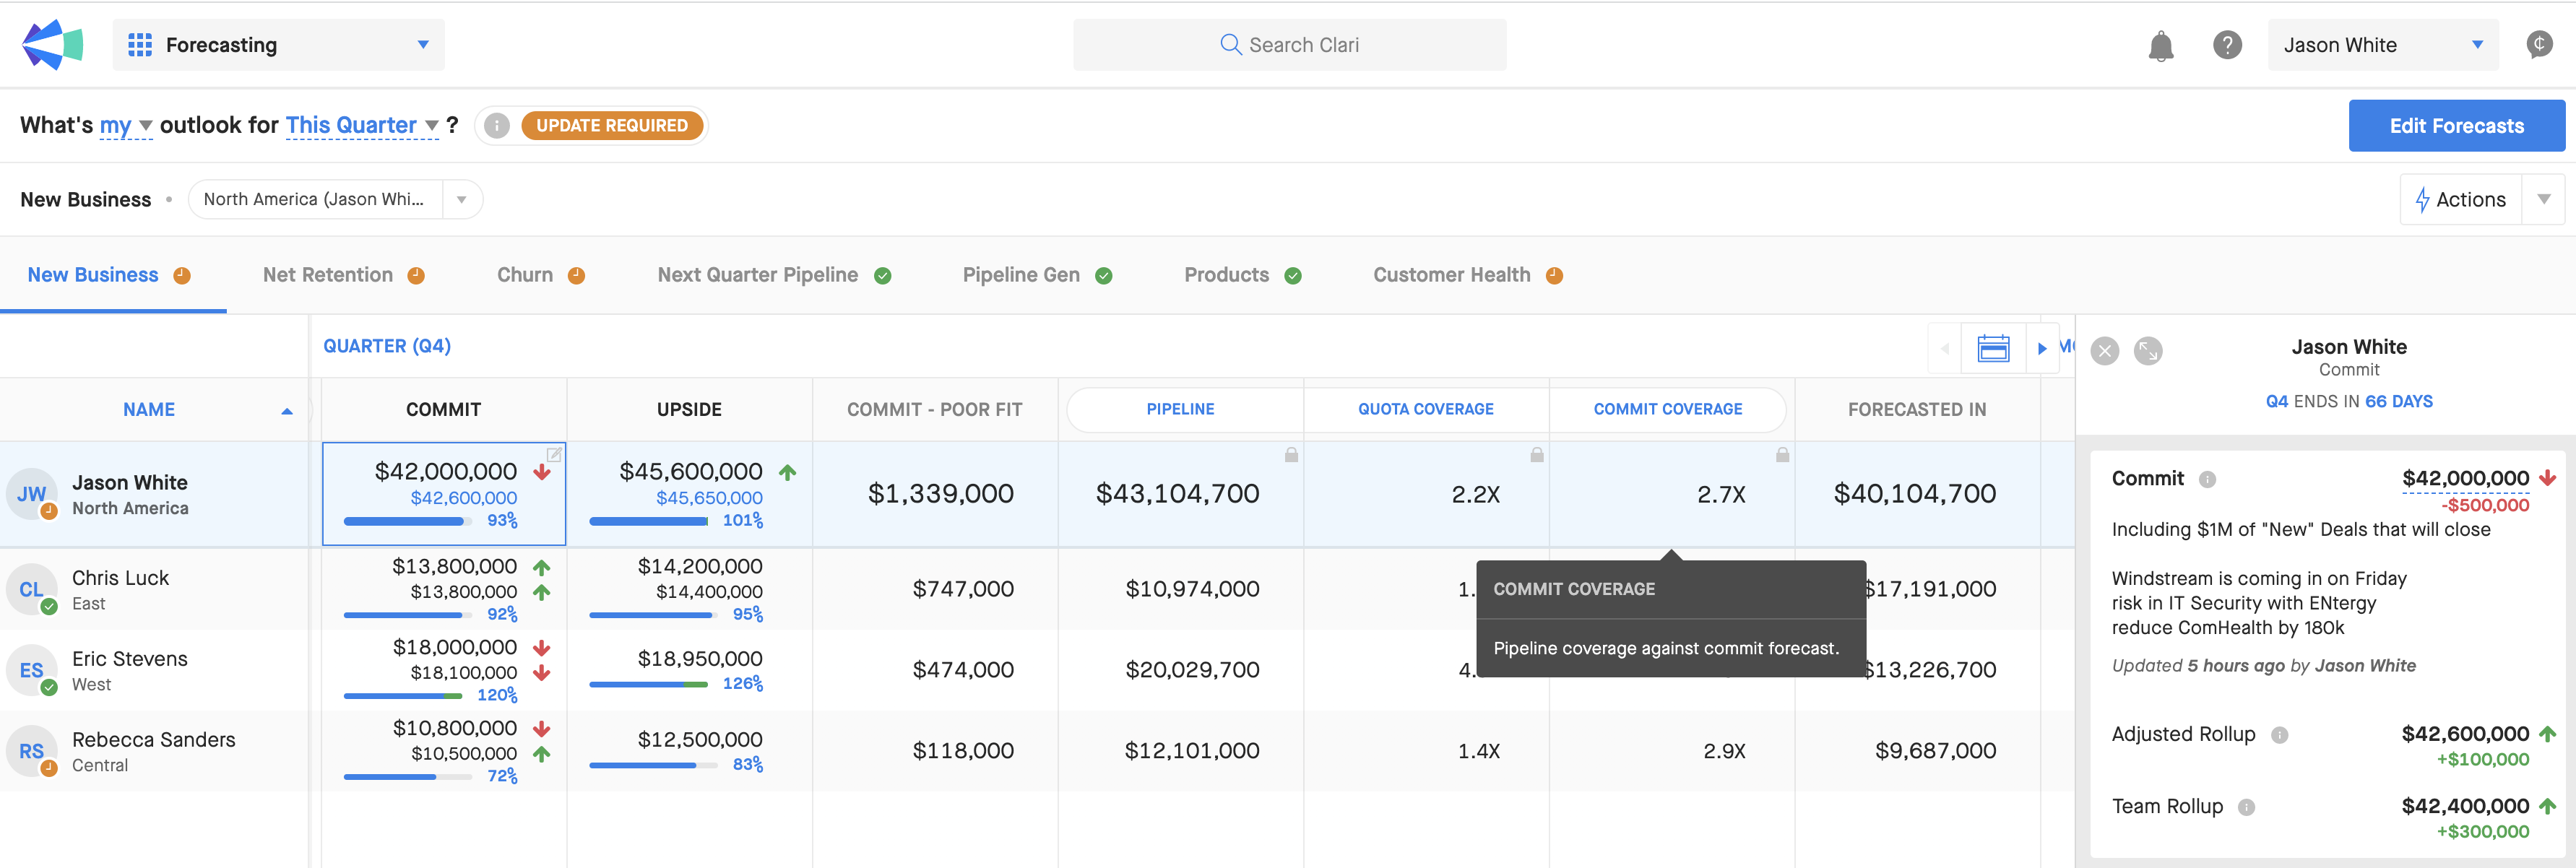
1. Do we have enough late-stage pipeline coverage to meet our forecast?
Let’s say you have 45 days left to go in the quarter. You called a $9m forecast and already closed $5m. With a $4m gap to reach your forecast, consider these two scenarios:
- You have $4M in late-stage pipeline (i.e., stage 3 deals and above), which means you only have 1x coverage, and it’ll take the rare feat of running the table to close 100% of those deals.
- You have $12M in pipe at 3x coverage, so you’re in a better position to progress and convert that pipeline in the next 45 days. Some of these deals may still get pushed out or decrease in size, but you have more buffer.
Each scenario requires a different set of actions, and as a revenue leader, it’s not enough to know how much you have in your commit bucket of deals. What you really need to know is if you have enough late-stage pipeline to help you bridge the gap.
Late-Stage Pipeline coverage = (S3+ Pipeline $) / (Forecast $ - Closed $)
Late-Stage (or strong) pipeline have different meanings for different organizations, so having the flexibility to define that designation is important towards measuring the true potential to hit your number. With this type of live information at the tip of your fingertips, leadership teams can help course correct as quickly as possible before it’s too late, especially in unpredictable times when top of funnel pipelines are slashed .
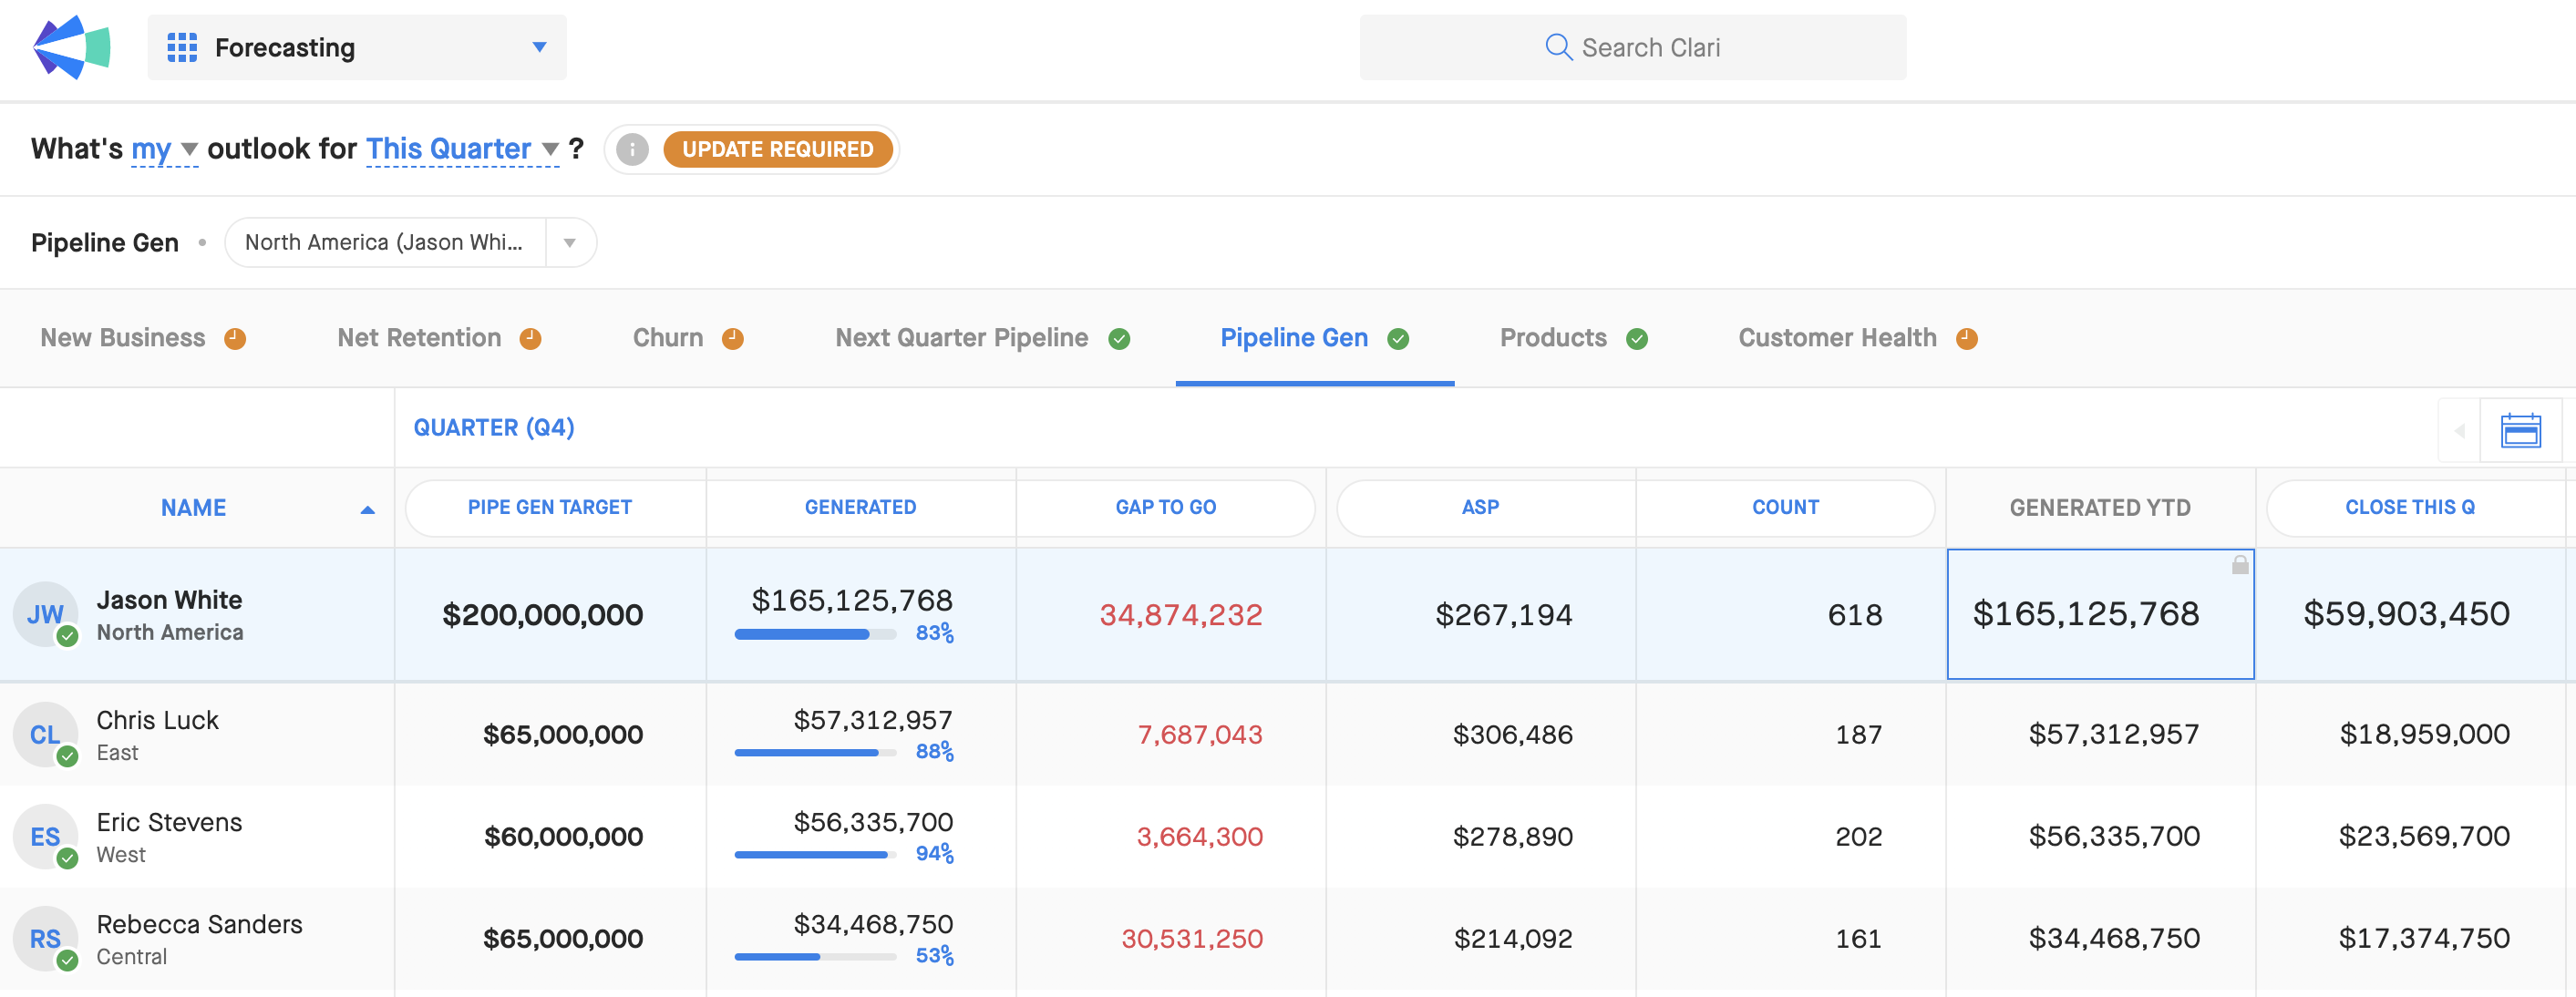
2. Are we sourcing and closing bigger ASPs compared to previous quarters?
When inspecting your pipeline for the quarter, your team is tracking against a $250k ASP (average selling price). That’s good news because it means they can source bigger deals compared to last quarter when the ASP was closer to $150k.
A more in-depth look shows you that while your east and west teams have been able generate deals north of $300k, the central team is still at a $250k ASP.
- So what’s driving that ASP gap?
- Do you have the right segmentation of accounts in the central region?
- Are the territories set up fairly?
- Do you need more coaching and enablement to help the central reps source bigger deals?
- Do we need to adjust marketing campaigns in the region to target more upmarket companies?
Answering all these questions 60 to 90 days before your next quarter will put you in a strong position to get your entire team on track to sourcing and closing bigger deals when that quarter finally comes around.
Average selling price (ASP) = Open Pipeline $ / Deal Count
Having visibility into ASP can open up a lot of conversations between the marketing, revenue development, and sales teams to ensure that there is proper coverage for not only the current quarter, but future quarters as well which are becoming an even more of a priority in current market conditions.
3. With unexpected churn, are we still on target to hit our net retention goals?
With increased market uncertainty, companies are putting greater emphasis on protecting their customer base, ensuring some element of stability despite a potential slowdown in net new logos. An example of how this is being measured is by introducing a net retention goal. Your net retention rate depends on the total renewal and upsell ARR you’ll be able to bring in minus churn. With budget pressures on even your happiest customers, you need to inspect churn in real-time and drive more focus and engagement around your renewals and upsells.
Net retention percentage = (Renewal ARR + Upsell ARR - Churn)/ Target Renewal ARR
Net retention is not a static number, so having the visibility into real-time renewal, upsell, and churn forecasts will help your sales and customer success teams rally around your existing customer base to drive satisfaction, retention and growth.
So what’s the catch?
These examples are just the tip of the iceberg. We all have sales metrics that are important to our business. For some, it might be pipeline coverage and ASP; for others, it might be about having the right product pipeline mix or providing net retention visibility. The reality is that most revenue teams are calculating these critical health metrics off-line in spreadsheets or BI tools, using stale data passed from team to team, and making decisions a few days too late during a time when you may need to change direction on a dime.
Introducing Adaptive Revenue Metrics
At Clari, we know how important it is to be able to inspect your business and take action in real-time. So, we’re excited to introduce Clari’s Adaptive Revenue Metrics.
Powered by the most up-to-the-minute CRM, forecast, and quota data, you can now instantly surface critical insights and align your marketing, sales, customer success, and finance teams on standardized KPIs throughout your GTM selling motions and hierarchy. With Clari’s flexible forecasting architecture, we can support any metric that matters most for your business and represent them in numbers, currency, percentages, or multipliers (hence the adaptive in the name 😉).
Our VP of Sales Anthony Cessario shares how revenue leaders can use these sales metrics to inspect the business and gain more revenue confidence:
More questions? We’ve got answers.
Have a specific revenue metric you’re tracking? We’d love to hear from you and discuss how we can support the unique needs of your business. Request a demo today.